
The average Woking home sold for £439,916 in July 2026, down just 0.3% on the year. Prices by type, Horsell to Sheerwater, and why Rightmove says £531,000.
If you own a home in Woking, or you are trying to buy one, the number you want is not the asking price in an agent’s window. It is what homes here actually change hands for, which HM Land Registry records once every sale completes. This is a plain read of those numbers for 2026: the borough average, which way it is moving, what each property type costs, how the villages compare with the town centre, and where Woking sits against Surrey and the rest of England.
The headline figure for 2026
The average home in the Woking borough sold for £439,916 in July 2026. That is the provisional figure from the official UK House Price Index, which is built from completed Land Registry sales rather than asking prices.
The fall has almost stopped. The July figure is £1,158 lower than a year earlier, a drop of 0.3%, against 3.0% a month earlier. Prices still fell in seven of the past twelve months, and England as a whole rose 1.1% over the year. Woking’s fall is the 80th steepest of England’s 295 local authority districts, 85 of which fell at all, having been 23rd steepest in June. The borough average is now £33,307 below its record high of £473,223, set in October 2022.
A note on the other numbers you will see. Search Rightmove and its Woking average is about £531,051, with sold prices around 3% down on the year before and 4% below the 2023 peak. That is not a contradiction. Rightmove’s figure is a raw average of sold prices in the Woking town listing area, which larger detached sales pull upward, while the £439,916 UK House Price Index figure is mix-adjusted across the whole borough, flats and all. PropertySolvers puts the wider Woking postcode area at £457,578, in between the two. All three are real; they measure different areas and different property mixes, so always check what a figure covers before you compare.
Prices by property type
The borough average hides a very wide spread. These are the Woking averages for July 2026 from the UK House Price Index:
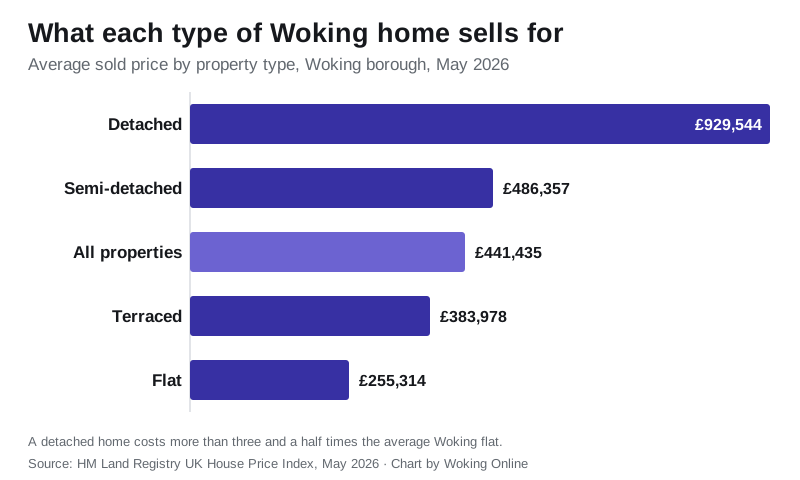
- Detached houses: £931,992. The Hook Heath and Pyrford end of the market, and unchanged over the year at 0.0%.
- Semi-detached houses: £485,692. Up 1.4%, the strongest of the four types.
- Terraced houses: £384,297. Up 1.1%, and the most common route into a house rather than a flat.
- Flats and maisonettes: £251,825. Down 2.6%, the only type that fell over the year.
Houses held their value while flats did not, and that one fact explains the whole borough figure. Woking has an unusually large flat market for a Surrey town, with the 34-storey Victoria Square towers completed in 2022 adding hundreds of town-centre apartments, so that £251,825 average carries a lot of the borough’s sales and drags the average down even in a month when houses rose. For buyers it means the gap between a flat and a detached house here is enormous: the average detached home costs 3.7 times the average flat.
First-time buyers and home movers
The same index splits buyers usefully. A first-time buyer in Woking paid an average of £334,264 in July 2026, down 0.4% on the year. A home mover, someone selling one property to buy another, paid an average of £581,634, down 0.1%. The £247,370 gap between those two figures is, in effect, the size of the step from a first flat or terrace to a family house in this borough.
Horsell, West Byfleet, Knaphill and Sheerwater compared
Woking is a borough of distinct villages, and the price gaps between them are larger than the gap between Woking and the rest of Surrey. These are sold-price averages for the last year from Rightmove’s locality pages, based on Land Registry sales registered to the end of April 2026:
| Area | Average sold price | Detached | Source |
|---|---|---|---|
| Horsell | £761,724 | £958,473 | Rightmove |
| West Byfleet | £605,239 | £889,854 | Rightmove |
| Knaphill | £444,160 | £622,552 | Rightmove |
| Sheerwater | £437,268 | n/a | Rightmove |
Horsell is the borough’s premium village, averaging around £762,000, followed by West Byfleet at about £605,000. Knaphill and Sheerwater sit around the £440,000 mark, close to the borough-wide average. At postcode level the same split shows up: Plumplot’s Land Registry analysis puts the cheapest postcode sector, GU21 6 near the town centre, at £313,000 and the priciest, GU22 0 on the Pyrford and Hook Heath side, at £959,000. Sheerwater’s year-to-year swings look dramatic in the data but come from a small number of sales, so treat its trend, not its level, with caution.
How Woking compares to Surrey and England
Woking is expensive by national standards and near the bottom of Surrey’s table. All figures are July 2026 from the UK House Price Index:
| Area | Average price | Annual change |
|---|---|---|
| Woking borough | £439,916 | -0.3% |
| Surrey | £522,523 | -0.4% |
| South East | £380,878 | +0.2% |
| England | £293,479 | +1.1% |
In plain terms, the average Woking home costs about £59,000 more than the typical South East home and £146,000 more than the England average, but roughly £83,000 less than the Surrey average, because Woking’s big flat market pulls its average below leafier boroughs like Waverley and Elmbridge. Only Spelthorne (£439,609) is cheaper in Surrey, and only by £307. The fast trains to Waterloo are a large part of what holds demand here even when the wider market cools.
What it means for you
If you are selling, the market you are in depends on what you are selling. Semis and terraces rose over the year; flats fell 2.6%. Price against recent sales of your own property type, not against the borough average. PropertySolvers’ data shows the typical Woking sale completing around £15,000 below asking and taking about 116 days, so a keen initial price beats a hopeful one followed by cuts, and any comparison drawn from 2022 will be well adrift. If you are buying, you have negotiating room across every property type, since all four fell over the year. And whatever you buy, check the council tax band before you offer: Woking’s council tax is among the higher bills in Surrey and it is a running cost of the property. If a home has been extended or a development is planned nearby, the planning applications register is the place to look before you commit.
Frequently asked questions
What is the average house price in Woking?
The average home in the Woking borough sold for £439,916 in July 2026, according to the provisional UK House Price Index built from HM Land Registry sales. Town-level averages weighted toward larger houses, such as Rightmove’s £531,051, run higher.
Are Woking house prices going up or down in 2026?
Barely. The July 2026 average was 0.3% lower than a year earlier, a fall of £1,158, after a 3.0% annual fall in June. Prices dropped in seven of the past twelve months. Flats were the only type to fall over the year, down 2.6%, while semis rose 1.4% and terraces 1.1%.
How much is a detached house in Woking?
A detached house in the borough averaged £931,992 in July 2026, 3.7 times the average Woking flat at £251,825.
Is Woking cheaper than the rest of Surrey?
Yes, on averages. Woking’s £439,916 sits about £83,000 below the Surrey average of £522,523, largely because Woking sells far more flats than most Surrey boroughs. Only Spelthorne is cheaper among Surrey’s eleven districts, and by only £307. Woking is still well above the South East (£380,878) and England (£293,479) averages.
Where are the most expensive parts of Woking?
Horsell, averaging around £762,000 over the last year, and the GU22 0 postcode sector covering Pyrford and Hook Heath, which Plumplot puts at £959,000. West Byfleet is next at about £605,000, while Knaphill and Sheerwater sit near £440,000.
Where can I check what a specific house sold for?
Every completed sale in England and Wales is public. Look up any street or address for free on the HM Land Registry Price Paid service, or browse the same data on Rightmove and Zoopla.
Sources
- UK House Price Index, Woking (ONS / HM Land Registry) for the borough average, property-type, buyer-type and comparator figures, July 2026.
- UK House Price Index average price data file, July 2026 release, for the England-wide district ranking, the number of falling districts, the record high and the Surrey comparison.
- Rightmove Woking sold prices and the Horsell, West Byfleet, Knaphill and Sheerwater locality pages.
- PropertySolvers Woking house prices for the postcode-area average, days-to-sell and sold-versus-asking gap.
- Plumplot Woking house prices for postcode-sector extremes.
- Victoria Square, Woking (Wikipedia) for the town-centre towers completed in 2022.
- HM Land Registry Price Paid search to check any individual address.
Updated 18 September 2026 to the July 2026 release. This page previously carried the first published June 2026 figure of £433,790, down 2.7% on the year. HM Land Registry has since revised that month to £432,668, down 3.0%. Figures are provisional and revised as more sales complete. Always confirm the latest numbers against the linked HM Land Registry and ONS sources before making a decision. What happens to supply next is set by the new Local Plan and its 12,656-home requirement, covered in Woking planning news.
Have your say