
1,900 people in Woking were claiming jobless benefits in October, the most since August 2021. Canalside ward's rate is 5.4%, the borough's 2.8%.
1,900 people in Woking borough were claiming unemployment-related benefits in October. That is the highest monthly figure since August 2021, when the count was still coming down from its pandemic peak.
The Office for National Statistics published the October figures on Tuesday 17 November (ONS claimant count via Nomis).
The count rose by 40 from September and by 110 from October 2025, when it was 1,790. The claimant rate held at 2.8 per cent of residents aged 16 to 64.
September has been revised down
Last month we reported that 1,890 people were claiming in September, a rise of 100 in a month. The ONS has since revised September to 1,860, so the rise from August was 70 rather than 100. Revisions like this are routine. The figures are rounded to the nearest five, and late benefit records are added after the first release.
Even on the revised figures, September and October together added 110 claimants in two months. The last time the borough’s count rose that much over two months outside the pandemic was in summer 2024.
Young people account for most of the yearly rise
Of the 110 extra claimants over twelve months, 70 are aged 16 to 24:
| Age | Oct 2025 | Sep 2026 | Oct 2026 | Change over year |
|---|---|---|---|---|
| 16 to 24 | 285 | 355 | 355 | +70 |
| 25 to 49 | 1,095 | 1,060 | 1,100 | +5 |
| 50 and over | 415 | 445 | 440 | +25 |
| All ages | 1,790 | 1,860 | 1,900 | +110 |
The under-25 figure stayed at 355, the joint highest since June 2021. It was 230 in September 2024. The month’s increase came among people aged 25 to 49, up 40 to 1,100, the most in that age group since June 2025.
By sex, 1,065 claimants are men and 835 are women.
Canalside has almost a quarter of the borough’s claimants
The ONS also publishes the count for each of Woking’s ten wards. Canalside, which takes in Maybury and Sheerwater, has 450 claimants, nearly one in four of the borough total. Its rate of 5.4 per cent is above the England average and more than four times the rate in Horsell.
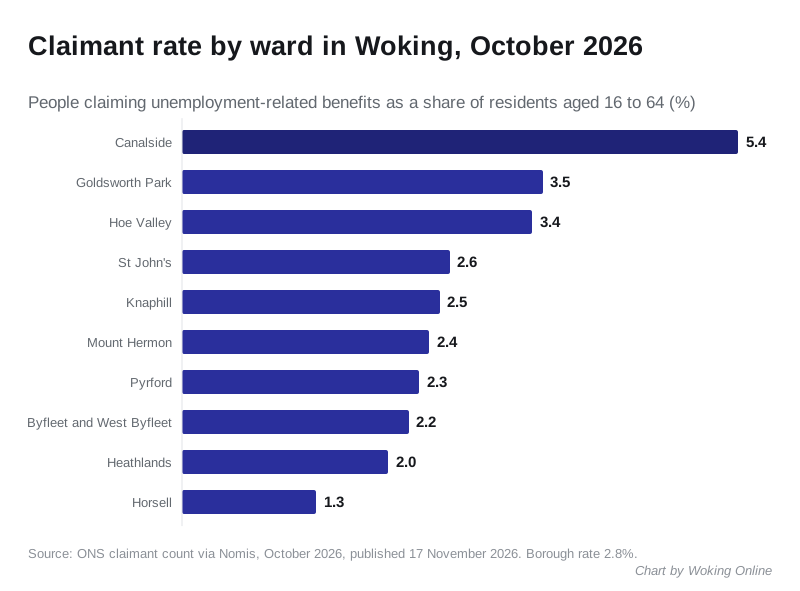
| Ward | Claimants | Rate | Change from September |
|---|---|---|---|
| Canalside | 450 | 5.4% | +15 |
| Goldsworth Park | 205 | 3.5% | +10 |
| Hoe Valley | 230 | 3.4% | no change |
| St John’s | 155 | 2.6% | no change |
| Knaphill | 180 | 2.5% | no change |
| Mount Hermon | 190 | 2.4% | +20 |
| Pyrford | 140 | 2.3% | no change |
| Byfleet and West Byfleet | 160 | 2.2% | no change |
| Heathlands | 115 | 2.0% | +5 |
| Horsell | 75 | 1.3% | no change |
Ward figures come from the same release (ONS ward claimant count via Nomis). Canalside also has the most claimants aged 16 to 24, at 85, followed by Hoe Valley with 60.
Still second in Surrey
Woking’s rate of 2.8 per cent is the second highest of Surrey’s eleven boroughs and districts. Only Spelthorne, at 3.6 per cent, is higher. Runnymede is third on 2.6 per cent.
The Surrey average is 2.4 per cent. The South East is on 3.2 per cent and England on 4.1 per cent (ONS claimant count for Surrey’s districts via Nomis).
What the figure counts
The claimant count is people claiming Jobseeker’s Allowance, plus Universal Credit claimants who are required to look for work. That can include people working a few hours on low pay. It is not the unemployment rate, which comes from a survey, and the ONS says the count “does not attempt to measure unemployment” (ONS, Claimant Count QMI).
What it means for you
- If you are out of work or on a low income, council tax support is the main local help, and Woking Borough Council runs it until April 2027. The new West Surrey Council is consulting on a draft scheme that would cut help for most working-age claimants, and the consultation closes on Thursday 3 December.
- If you are under 25, you are in the group whose numbers have risen fastest over the past year, in Woking and across Surrey.
- The next release, covering November, is due from the ONS in mid-December.
Frequently asked questions
What is the Woking claimant count in October 2026?
1,900 people in Woking borough were claiming unemployment-related benefits in October 2026, or 2.8 per cent of residents aged 16 to 64. That is the highest since August 2021. Of the total, 355 were aged 16 to 24, 1,100 were 25 to 49 and 440 were 50 or over.
Which part of Woking has the most claimants?
Canalside ward, with 450 claimants and a rate of 5.4 per cent. Horsell has the lowest rate, at 1.3 per cent.
Why did the September figure change?
The ONS revises earlier months as late benefit records come in. September was first published as 1,890 and is now 1,860.
Sources
- ONS claimant count for Woking via Nomis, published 17 November 2026 (monthly totals since October 2020, age bands, sex and rate from the same table)
- ONS ward claimant count for Woking via Nomis, September and October 2026
- ONS claimant count for Surrey’s districts via Nomis, October 2026
- ONS: Claimant Count Quality and Methodology Information
Figures are rounded to the nearest five by the ONS. Checked against the sources above on 17 November 2026.
Have your say