
Woking's average home sold for £441,783 in September, a third monthly rise. The yearly fall shrank to 0.4% and Woking stays Surrey's cheapest district.
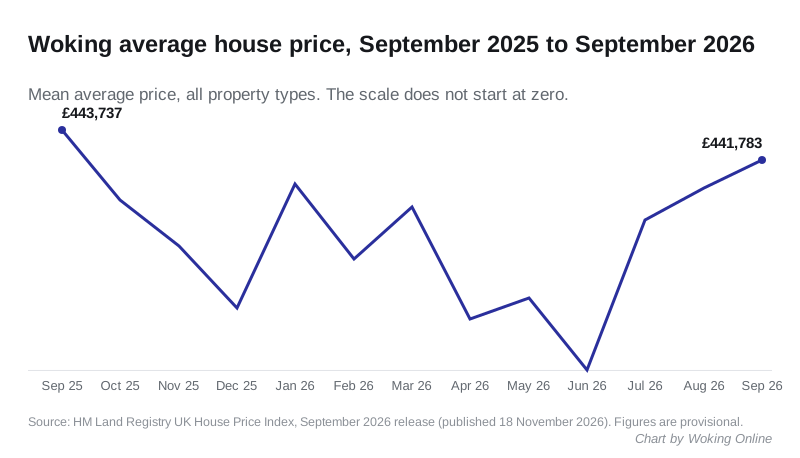
The average home in Woking sold for £441,783 in September. That is up 0.4 per cent on August and the third monthly rise in a row.
Over the year the borough average is still down, by 0.4 per cent, or £1,954. That is the smallest annual fall Woking has recorded since prices last rose year on year, in June 2025.
The figures come from the HM Land Registry UK House Price Index, published on Wednesday 18 November. The index is a mean average, not a median, and every recent month is provisional.
Three rises since the June low
The borough average bottomed out at £428,112 in June. It has risen in each month since:
- July: up 2.3 per cent, to £437,921
- August: up 0.5 per cent, to £440,003
- September: up 0.4 per cent, to £441,783
That is a gain of £13,671 since June. The average is still £31,440 below Woking’s record of £473,223, set in October 2022.
Semis and terraces are up on a year ago
Houses are now doing better than the borough figure suggests. Semi-detached and terraced homes both cost more than in September 2025. Flats are still falling, and they pull the average down.
| Property type | Average, September 2026 | Annual change |
|---|---|---|
| Detached | £934,736 | -0.2% |
| Semi-detached | £488,126 | +0.9% |
| Terraced | £385,638 | +0.5% |
| Flat or maisonette | £253,051 | -2.4% |
A first-time buyer paid an average of £335,983, down 0.6 per cent on the year. A home mover paid £583,778, down 0.3 per cent.
Still Surrey’s cheapest district, by £783
Woking is the cheapest of Surrey’s eleven districts for the second month running. The gap to Spelthorne is now just £783:
| District | Average price, September 2026 | Annual change |
|---|---|---|
| Woking | £441,783 | -0.4% |
| Spelthorne | £442,566 | -0.1% |
| Surrey Heath | £464,274 | +1.6% |
| Runnymede | £474,108 | -1.3% |
| Reigate and Banstead | £480,209 | -1.4% |
| Tandridge | £497,914 | -3.0% |
| Guildford | £539,247 | +1.1% |
| Mole Valley | £546,904 | +0.3% |
| Waverley | £560,795 | +0.5% |
| Epsom and Ewell | £562,395 | +4.1% |
| Elmbridge | £740,883 | +3.2% |
Five districts fell over the year and six rose. Tandridge, down 3.0 per cent, now has the steepest fall in the county, a place Woking held in last month’s first figures.
The Surrey average was £524,471, up 0.5 per cent. A Woking home is about £82,700 below it. Against the wider picture Woking is still dear: the South East averaged £378,915 (down 0.2 per cent) and England £292,998 (up 0.8 per cent).
August was revised up
Last month we reported that Woking’s August average was £437,628, down 2.7 per cent, the steepest fall in Surrey. HM Land Registry now puts August at £440,003, down 2.1 per cent. That is £2,375 higher than first published.
July has moved again too. It was first published at £439,916, cut to £436,752 last month, and now stands at £437,921.
Late sale completions keep arriving for several months, so first estimates are routinely revised. The September figure will be revised as well. The direction over several months is a safer guide than any single month.
What it means for you
If you are buying a house, the cheap-Woking story is mostly about flats. Semis and terraces are now dearer than a year ago, so expect less room to haggle than the headline fall suggests.
If you are selling a flat, yours is still the type that is falling, by 2.4 per cent over the year. Price against recent sales of similar flats nearby, not the borough average.
Before you offer on anything, check the council tax band, which goes with the property. Our Woking house prices page has the longer picture, including how the villages compare.
Sources
- UK House Price Index, Woking borough, HM Land Registry, September 2026 release, for the borough average, the monthly series, the property-type and buyer-type figures, the revised July and August figures and the October 2022 record.
- UK House Price Index linked data, HM Land Registry, for the ten other Surrey districts, Surrey, the South East and England.
- UK House Price Index reports, HM Land Registry, for the revision policy.
Have your say