
A 99% pass rate across A level and vocational courses, 55% of students at A*, A, B or Distinction, and 417 into their first-choice university. How it compares nationally.
Woking College has published its summer 2026 results, and they are strong. The college reports a 99% pass rate across A level and vocational courses combined, with 55% of students achieving A*, A, B or Distinction. It says this is the sixteenth consecutive year its results have come in significantly above the national average.
The clearest number for families is on destinations. 417 students, more than 75% of the college’s UCAS applicants, secured a place at their first-choice university. A further 34 got in through their insurance offer. The college names Oxford, Cambridge, Imperial College London, Russell Group universities and medical schools among this year’s destinations (Woking College).
Principal Nuweed Razaq, who was himself a student at the college, said the results reflected “years of hard work, perseverance and ambition” and thanked staff whose “commitment, expertise and encouragement have helped our students achieve their goals”.
What the national picture actually looked like
A level results day was Thursday 13 August. Ofqual published the national figures the same morning, and they are the benchmark worth knowing (Ofqual, qualification results in England: summer 2026):
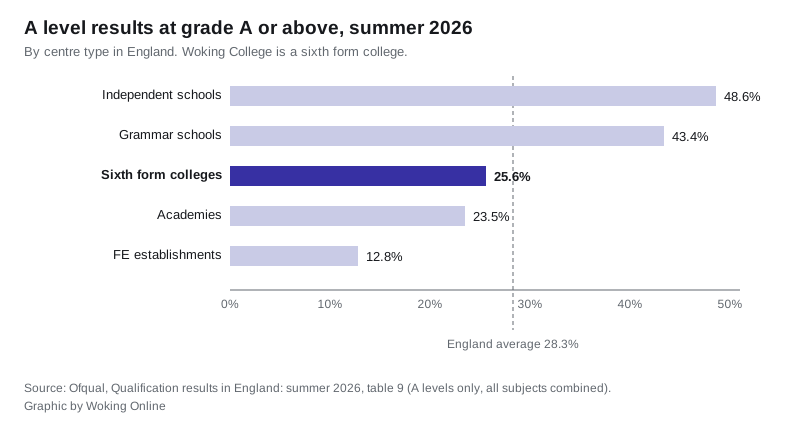
- England: 28.3% of A level results were at grade A or above, from 835,950 results. That is up slightly on 28.2% in 2025.
- South East: 31.5% at A or above, from 166,940 results, and 79.5% at C or above. Only London did better.
- Sixth form colleges, the category Woking College sits in: 25.6% at A or above and 78.1% at C or above. Both are up on 2025, when the figures were 25.1% and 77.2%.
- For comparison, independent schools recorded 48.6% at A or above, grammar schools 43.4%, academies 23.5% and further education establishments 12.8%.
Why you cannot line those numbers up side by side
This is the part most results-day coverage skips, and it matters if you are trying to judge a school or college.
Ofqual reports A levels only, and only at two thresholds: grade A and above, and grade C and above. Colleges publish something different. Woking College’s 99% and 55% cover A level and vocational courses together, and the 55% counts A*, A, B or Distinction, which is a wider band than anything Ofqual publishes at regional or centre-type level.
So the college’s headline figures cannot be set against the national ones directly. They are best read against the college’s own previous years. The Ofqual tables are still useful, because they tell you what a typical sixth form college result looked like this summer, and they show the gap between centre types is far wider than the gap between regions.
One further caveat on any borough league table you may see. Ofqual now publishes A level outcomes by local authority area, but grades are assigned to an area by the postcode of the exam centre, not by where the student lives. A district with a large selective or independent school ranks high on other people’s children.
Elsewhere in the borough
St John the Baptist School in Woking told its followers on results day that its Year 13 cohort had achieved “some of the best ever at SJB” (St John the Baptist School). The school has not yet published headline percentages for 2026. Its most recent published figures, for 2024-25, were 39% at A* to A, 74% at A* to B and 92% at A* to C, with an average points score equivalent to AAB (SJB exam results).
GCSE results follow on Thursday 20 August.
What it means for you
If a grade looks wrong, there is a clock running. The Joint Council for Qualifications sets the summer 2026 deadlines (JCQ post-results services):
- Priority review of marking: 20 August 2026. A level, T Level and Level 3 VTQ only, for students whose university place depends on the outcome. Turnaround is within 15 calendar days.
- Standard review of marking: 24 September 2026. Turnaround within 20 calendar days.
- Clerical re-check: 24 September 2026. Turnaround within 10 calendar days.
Two things families regularly get wrong. The request goes through the school or college’s exams officer, not direct to the exam board, and written consent from the student is required after results are published. And there is no grade protection: a mark can go down as well as up.
If you are moving into the area for a school place, our Woking council tax bands and Woking house prices pages set out the other side of that decision.
Sources
- Woking College: Outstanding Results 2026, published 17 August 2026 (pass rate, high grades, UCAS destinations, principal’s comment)
- Ofqual: qualification results in England, summer 2026, data tables 8 and 9 (results by region and by centre type)
- St John the Baptist School and its exam results page (results day statement, 2024-25 figures)
- JCQ: post-results services (review of marking and clerical re-check deadlines, turnaround times, consent)
Have your say