
The average Woking home sold for £433,790 in June, down £12,057 on the year. Only 62 of England's 295 districts fell, and Woking's is the 23rd steepest.
The average home in Woking borough sold for £433,790 in June, according to the UK House Price Index published by HM Land Registry. That is £12,057 less than a year earlier, a fall of 2.7 per cent.
It was also a weak month on its own. Prices dropped 1.5 per cent between May and June, the joint steepest monthly fall of the past year, level with September 2025.
The wider picture makes the fall stand out more than the number suggests. England as a whole rose 1.8 per cent over the same year. Of the 295 local authority districts in England, only 62 recorded any annual fall at all, and Woking’s is the 23rd steepest of the 295.
What each type of home costs now
June averages for the borough, with the change on June 2025:
- Detached: £913,878, down 3.9 per cent
- Semi-detached: £477,308, down 1.5 per cent
- Terraced: £376,969, down 1.4 per cent
- Flats: £251,157, down 3.3 per cent
- First-time buyers paid £330,202 on average, down 2.3 per cent
The two ends of the market fell hardest. Detached houses and flats both lost more than 3 per cent, while the terraced and semi-detached middle held up better. Woking has an unusually large flat market for Surrey, which is why the borough average sits well below the county figure.
Surrey is pulling in two directions
The county average fell 1.2 per cent to £519,877. That single number hides a split of more than 11 percentage points between its districts.
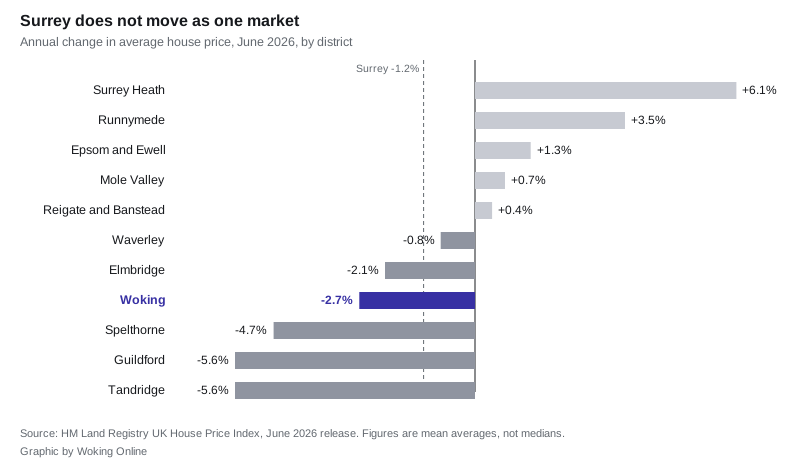
Surrey Heath, immediately north west of the borough, rose 6.1 per cent. Runnymede, immediately north east, rose 3.5 per cent. Both border Woking. Guildford next door fell 5.6 per cent, and so did Tandridge.
Woking sits in the falling half but not at the bottom of it. Its 2.7 per cent drop is milder than Guildford, Tandridge and Spelthorne, and steeper than Elmbridge and Waverley.
Still £39,433 below the 2022 peak
Woking’s highest monthly average on record is £473,223, set in October 2022. June 2026 is £39,433 below that, a gap of 8.3 per cent.
The market has not fallen in a straight line since. Prices went down in eight of the past twelve months and up in four, which is why the borough average keeps drifting sideways at a slightly lower level each year rather than dropping sharply.
Fewer homes are changing hands
The index publishes sales counts about three months behind prices, so the most recent complete figure is 84 sales in April 2026.
Adding up January to April gives 341 sales in 2026 against 564 in the same months of 2025. That comparison needs a warning attached. The 2025 figures were distorted by the stamp duty threshold change on 1 April that year, which pulled completions forward: Woking recorded 260 sales in March 2025 and just 50 in April. Nothing similar happened in 2026, so the monthly pattern this year is much flatter.
A correction to the May figure
The Land Registry revises its recent months as more completed sales are registered, and May 2026 has now been revised down.
- First published: £441,435, up 0.4 per cent on the year
- Now: £440,185, up 0.1 per cent on the year
That is a cut of £1,250. Our own Woking house prices page carried the original May figure and has been updated to June.
What it means for you
If you are selling, the borough average has now fallen for most of the past year, and asking prices set from 2022 comparisons are likely to be well adrift. Detached homes have taken the largest hit in percentage terms.
If you are buying, the average first-time buyer paid £7,936 less than a year ago. Woking is now the second cheapest district in Surrey: £3,874 above Spelthorne, and £27,606 below Surrey Heath.
One caveat that matters. The UK House Price Index average is a mean, not a median, and it is mix-adjusted across the whole borough. A handful of large sales in Pyrford or Hook Heath moves it in a way that has nothing to do with what a Sheerwater flat is worth. Treat it as a direction of travel for the borough, not a valuation of your street.
Council tax bands are set from 1991 values and do not move with the market. Our Woking council tax bands page explains what each band costs this year.
Sources
- UK House Price Index, Woking borough, June 2026, HM Land Registry.
- UK House Price Index full data file, June 2026 release, used for the district rankings, the Surrey comparison, the sales volumes and the revision to May.
Have your say