
Woking's annual fall shrank from 3.0% to 0.3% in a month, to an average £439,916. Flats fell 2.6% while semis and terraces rose. Only Spelthorne is cheaper.
The average Woking home sold for £439,916 in July, and the borough’s year-long price fall has almost disappeared. Prices were down 0.3 per cent on July 2025, against a 3.0 per cent fall recorded a month earlier (HM Land Registry UK House Price Index).
In cash, the average is £1,158 lower than a year ago. In June it was £13,179 lower.
That is a large swing for one month, and it moved Woking a long way down the national table. The borough had the 23rd steepest annual fall of England’s 295 local authority districts in June. In July it was 80th, and the number of districts falling at all rose from 62 to 85.
One caution before the detail. The UK House Price Index is a mean average, not a median, and it is mix-adjusted across the whole borough. A handful of large sales in Hook Heath does not move it the way a raw average would, but it is still an average of a very mixed market.
Flats fell, houses did not
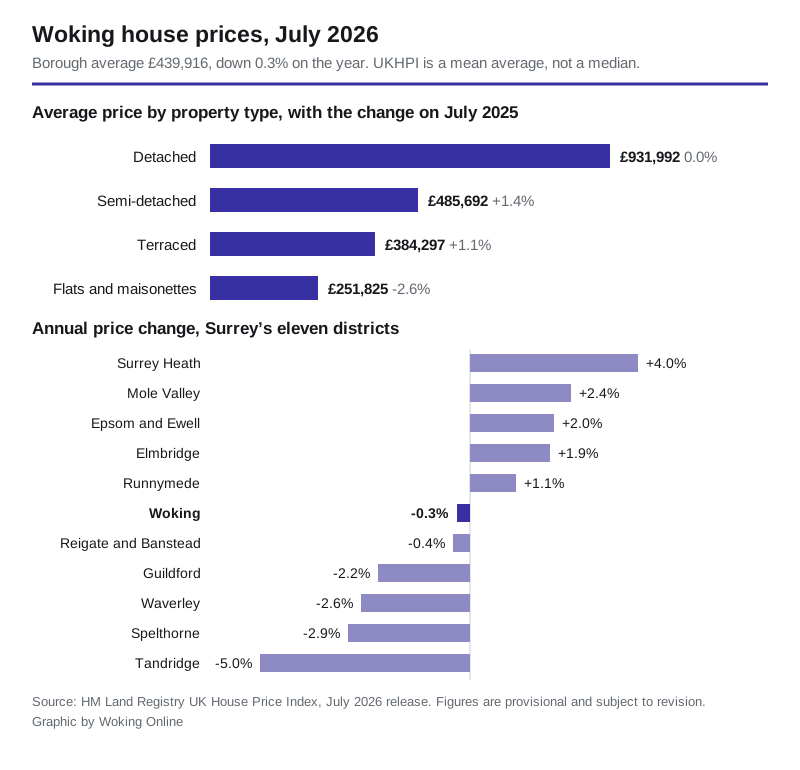
The borough average hides a split that matters if you are buying here:
- Detached: £931,992, unchanged over the year at 0.0 per cent
- Semi-detached: £485,692, up 1.4 per cent
- Terraced: £384,297, up 1.1 per cent
- Flats and maisonettes: £251,825, down 2.6 per cent
So three of the four types were flat or rising. The fall in the borough average is being carried almost entirely by flats, and Woking has an unusually large flat market for a Surrey borough thanks to the town centre towers. A falling flat average pulls the whole borough figure down even when houses are steady.
A first-time buyer paid an average of £334,264, down 0.4 per cent on the year. Someone moving from one property to another paid £581,634, down 0.1 per cent.
Only Spelthorne is cheaper in Surrey, by £307
Woking remains close to the bottom of the county table on price. Its £439,916 is the second lowest of Surrey’s eleven districts, and the gap to the cheapest is now almost nothing:
| District | Average price, July 2026 | Annual change |
|---|---|---|
| Spelthorne | £439,609 | -2.9% |
| Woking | £439,916 | -0.3% |
| Surrey Heath | £457,988 | +4.0% |
| Runnymede | £477,182 | +1.1% |
| Reigate and Banstead | £480,824 | -0.4% |
| Tandridge | £482,599 | -5.0% |
| Guildford | £532,917 | -2.2% |
| Waverley | £553,429 | -2.6% |
| Mole Valley | £555,858 | +2.4% |
| Epsom and Ewell | £568,214 | +2.0% |
| Elmbridge | £748,080 | +1.9% |
On the direction of travel rather than the level, Woking sits sixth of the eleven. Surrey Heath rose most at 4.0 per cent; Tandridge fell hardest at 5.0 per cent. The county average was £522,523, down 0.4 per cent, so a Woking home is about £82,600 below the Surrey average.
Against the wider picture, Woking is still expensive. England averaged £293,479 in July, up 1.1 per cent, and the South East £380,878, up 0.2 per cent.
The month-on-month figure is worth a line of its own. Woking rose 1.7 per cent between June and July, the third largest monthly rise in Surrey behind Mole Valley and Spelthorne. The borough average is now £33,307 below its record high of £473,223, set in October 2022.
June was revised down
The June figure we reported has changed. When it was first published, June 2026 stood at £433,790, a fall of 2.7 per cent on the year. HM Land Registry now puts that month at £432,668, down 3.0 per cent.
This is normal. Every UK House Price Index month is provisional and gets revised as late sale completions are registered, and the revision usually runs a month or two behind. It is also why a single month’s figure is worth less than the direction over several.
What it means for you
If you are selling a house, the market you are in is not the one the headline describes. Semi detached and terraced prices rose over the year; the borough-wide fall comes from flats. Price against recent sales of your property type, not against the borough average.
If you are selling a flat, yours is the only type in the borough that fell over the year, by 2.6 per cent. It is also the only one that fell in every Surrey district bar two, so the weakness is regional rather than something particular to Woking.
If you are a first-time buyer, £334,264 is what the average one paid in July. That is £105,652 below the borough average, which is a reminder that the typical first purchase in Woking is a flat or a terrace rather than a house.
Before you offer on anything, check the council tax band, which is a running cost that follows the property, and search the planning register for anything proposed nearby. Our Woking house prices page carries the longer picture, including how the villages compare.
Sources
- UK House Price Index, Woking borough, July 2026, HM Land Registry, for the borough average, the property-type and buyer-type figures and the annual and monthly changes.
- UK House Price Index average price data file, July 2026 release, for the England-wide district ranking, the number of falling districts, the record high of October 2022 and the Surrey comparison table.
- UK House Price Index reports, HM Land Registry, for the revision policy and the note that figures are provisional.
Have your say