
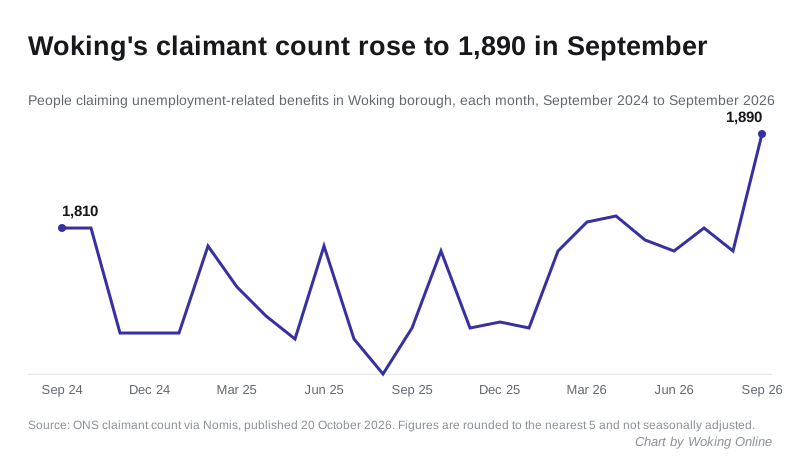
Woking's claimant count rose by 100 to 1,890 in September, level with the highest since 2021. The rate moved to 2.8%, second in Surrey after Spelthorne.
1,890 people in Woking borough were claiming unemployment-related benefits in September. That is 100 more than in August, and level with September 2021 as the highest monthly figure in five years.
The Office for National Statistics published the September figures on Tuesday 20 October (ONS claimant count via Nomis).
The claimant rate moved for the first time since February. It had been 2.7 per cent of residents aged 16 to 64 every month from February to August. In September it was 2.8 per cent.
A bigger rise than September usually brings
The claimant count is not seasonally adjusted, and it often ticks up between August and September. In Woking the August to September change was:
- +25 in 2022
- +70 in 2023
- +20 in 2024
- +40 in 2025
- +100 in 2026
This year’s rise is the largest month-on-month increase in the borough since February 2021, during the pandemic.
Over twelve months the count is up 165, from 1,725 in September 2025.
August’s figure has also been revised. Last month’s release gave 1,810; this month’s puts August at 1,790. The figures are rounded to the nearest five, and small revisions are routine.
Every age group rose
The September increase was spread across all ages, with the biggest jump among people aged 25 to 49:
| Age | Sep 2025 | Aug 2026 | Sep 2026 |
|---|---|---|---|
| 16 to 24 | 275 | 340 | 355 |
| 25 to 49 | 1,055 | 1,010 | 1,080 |
| 50 and over | 395 | 435 | 450 |
| All ages | 1,725 | 1,790 | 1,890 |
The under-25 figure, which we reported last month had reached its highest level since 2021, rose again. At 355 it is the highest since June 2021 (our August report).
Claimants aged 25 to 49 were fewer in August than a year earlier. They rose by 70 in September alone.
Second highest in Surrey
Woking’s rate is the second highest of Surrey’s eleven boroughs and districts, behind Spelthorne:
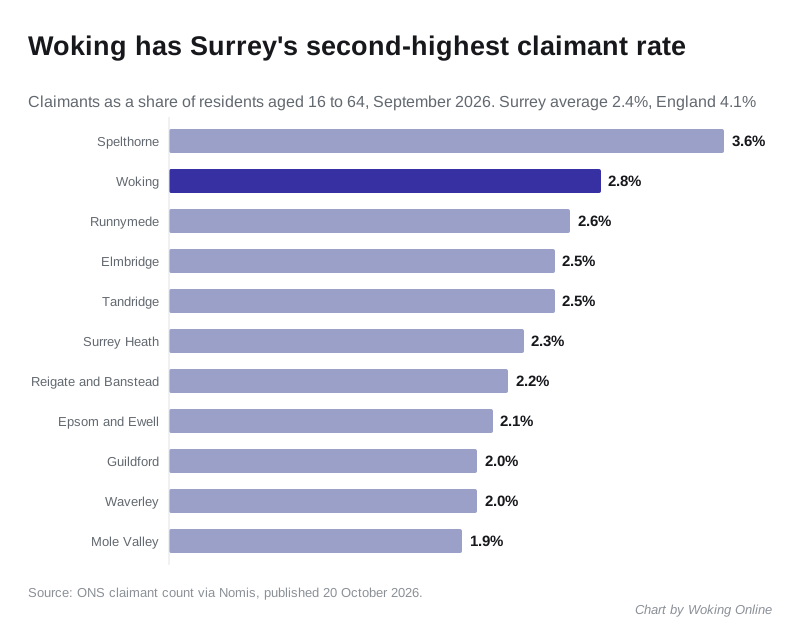
The Surrey average is 2.4 per cent. Woking remains below the South East, at 3.1 per cent, and well below England, at 4.1 per cent.
The rise over the year is not just a Woking story. Ten of Surrey’s eleven districts have a higher rate than in September 2025; only Tandridge is unchanged.
What the figure counts
The claimant count is people claiming Jobseeker’s Allowance, plus Universal Credit claimants who are required to look for work. It is not the same as the unemployment rate, which comes from a survey. Changes to who must look for work under Universal Credit can move the count without any change in jobs.
What it means for you
- If you are out of work or on a low income, council tax support is the largest local help, and Woking Borough Council runs it. From April 2027 it passes to the new West Surrey Council, whose draft scheme would cut help for 2,206 of Woking’s 2,212 working-age claimants. The consultation is open until Thursday 3 December. Our report on the draft scheme sets out who is affected.
- If you are under 25, you are in the group whose numbers have risen fastest over two years, in Woking and across Surrey.
- The next release, covering October, is due from the ONS in mid-November.
Frequently asked questions
What is the Woking claimant count in September 2026?
1,890 people in Woking borough were claiming unemployment-related benefits in September 2026, or 2.8 per cent of residents aged 16 to 64. That is up 100 on August and 165 on September 2025. Of the total, 355 were aged 16 to 24, 1,080 were 25 to 49 and 450 were 50 or over.
Is Woking’s claimant rate high for Surrey?
Yes. At 2.8 per cent it is the second highest of Surrey’s eleven boroughs and districts, behind Spelthorne on 3.6 per cent. The Surrey average is 2.4 per cent and the England figure is 4.1 per cent.
Sources
- ONS claimant count for Woking via Nomis, published 20 October 2026 (monthly totals, age bands and rates; earlier years from the same series)
- ONS claimant count for Surrey’s districts, the South East and England via Nomis, September 2025 and September 2026
Have your say