
Woking's under-25 claimant count reached 345 in August, the highest since May 2021 and more than double the 2022 low. The borough total held at 1,810.
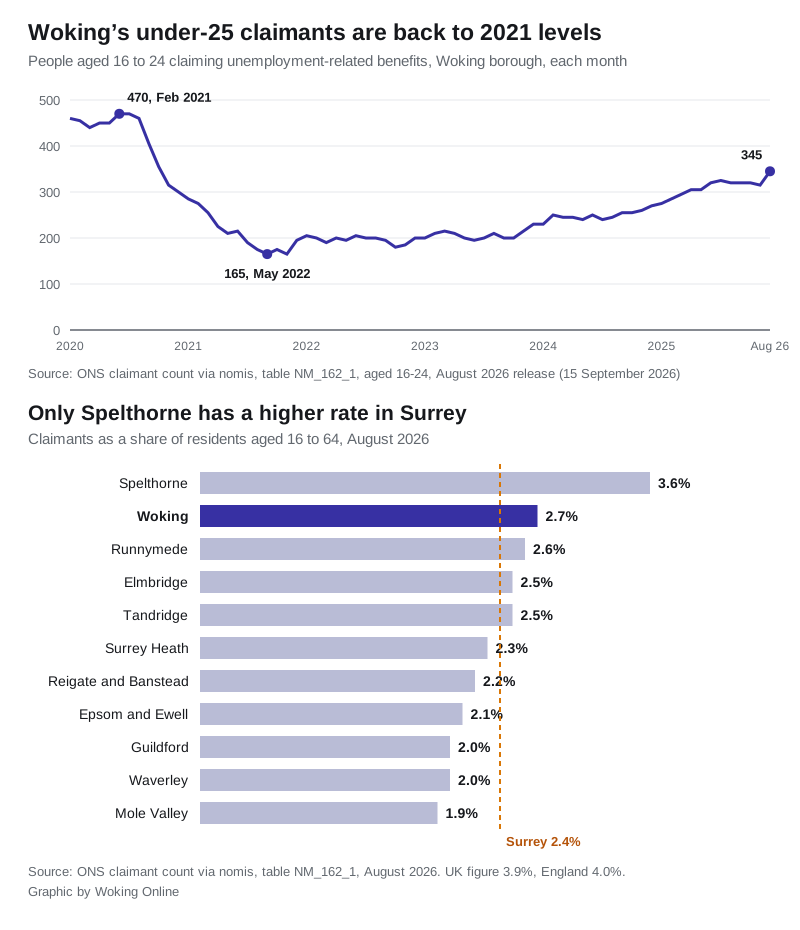
345 people aged 16 to 24 in Woking borough were claiming unemployment-related benefits in August. That is the highest monthly figure since May 2021, when the furlough scheme was still running, and it is more than double the low of 165 reached in May 2022.
The Office for National Statistics published the August figures on 15 September (ONS claimant count via nomis).
The borough total did not move. 1,810 people of all ages were claiming, exactly the same as in July, and 2.7 per cent of residents aged 16 to 64. That rate has now been stuck at 2.7 per cent every month since February.
So the headline number is flat and the age mix underneath it is not.
The under-25 number has risen every year since 2022
Woking’s under-25 claimant count was 270 in August 2025. It is 345 now, a rise of 75 in twelve months, or 28 per cent.
Step back further and the shape is clearer:
- 470 in February and March 2021, the pandemic peak
- 165 in May 2022, the lowest month in six years
- 230 in August 2024
- 270 in August 2025
- 345 in August 2026
Under-25s now make up 19 per cent of all claimants in the borough. A year ago they were 16 per cent.
Set against the other age groups, the whole of the borough’s annual increase sits at the two ends of the working-age range. The number of claimants aged 25 to 49 has not moved at all in twelve months:
| Age | Aug 2025 | Aug 2026 | Change |
|---|---|---|---|
| 16 to 24 | 270 | 345 | +75 |
| 25 to 49 | 1,030 | 1,030 | no change |
| 50 and over | 385 | 435 | +50 |
| All ages | 1,685 | 1,810 | +125 |
By sex, 1,005 of the borough’s claimants are men and 800 are women.
Only Spelthorne has a higher rate in Surrey
At 2.7 per cent of working-age residents, Woking has the second highest claimant rate of Surrey’s eleven boroughs and districts. Only Spelthorne, at 3.6 per cent, is above it.
| District | Rate | Claimants |
|---|---|---|
| Spelthorne | 3.6% | 2,400 |
| Woking | 2.7% | 1,810 |
| Runnymede | 2.6% | 1,540 |
| Elmbridge | 2.5% | 2,110 |
| Tandridge | 2.5% | 1,375 |
| Surrey Heath | 2.3% | 1,345 |
| Reigate and Banstead | 2.2% | 2,215 |
| Epsom and Ewell | 2.1% | 1,080 |
| Guildford | 2.0% | 1,965 |
| Waverley | 2.0% | 1,570 |
| Mole Valley | 1.9% | 985 |
Surrey as a whole is on 2.4 per cent. The UK figure is 3.9 per cent and England’s is 4.0 per cent, so every Surrey district is well below the national rate (ONS claimant count via nomis).
The rise in young claimants is a Surrey-wide story
Woking is not an outlier. Across Surrey, the number of 16 to 24 year olds claiming rose from 2,825 in August 2025 to 3,385 in August 2026, a rise of about 20 per cent.
Ranked by the twelve-month change in under-25 claimants:
| District | Aug 2025 | Aug 2026 | Change |
|---|---|---|---|
| Waverley | 195 | 275 | +41% |
| Surrey Heath | 205 | 270 | +32% |
| Elmbridge | 280 | 360 | +29% |
| Woking | 270 | 345 | +28% |
| Runnymede | 235 | 295 | +26% |
| Reigate and Banstead | 355 | 435 | +23% |
| Guildford | 335 | 400 | +19% |
| Spelthorne | 375 | 420 | +12% |
| Tandridge | 225 | 245 | +9% |
| Mole Valley | 165 | 165 | no change |
| Epsom and Ewell | 190 | 175 | -8% |
Epsom and Ewell is the only district in the county where the number of young claimants fell.
On the all-ages measure Woking’s twelve-month rise was 125, or 7.4 per cent, the fourth steepest in Surrey behind Waverley, Runnymede, and Reigate and Banstead.
What the claimant count is, and what it is not
This is not the unemployment rate, and the ONS is explicit about it. Its methodology note says the Claimant Count “does not attempt to measure unemployment, which is a concept defined by the International Labour Organisation (ILO) as all those who are out of work, actively seeking work and available to start work” (ONS, Claimant Count QMI).
What it does measure is “the number of people claiming benefits principally for the reason of being unemployed, based on administrative data from the benefits system”. In practice that means Jobseeker’s Allowance claimants plus Universal Credit claimants who are required to look for work, which can include some people already working a small number of hours on very low earnings.
It is still the only jobs figure published every month at borough level, which is why it is worth watching. Two further cautions apply to the tables above. The figures are rounded to the nearest five, so small month-to-month moves can be noise. And earlier months are revised, which is why our report on the June figures put that month at 1,795 where the current series has 1,790.
What it means for you
If you are out of work or on a low income in the borough:
- Council tax support is the largest local help available, and it is administered by Woking Borough Council rather than by the Jobcentre. Our guide to Woking council tax bands sets out what each band costs before any reduction is applied.
- The next release is Tuesday 20 October 2026, covering September. The ONS publishes the claimant count monthly, on the third Tuesday.
- If you are under 25, you are in the group these figures are moving fastest for, in Woking and across Surrey. That is a reason to ask about support early rather than late.
For the wider picture of the local economy, our Woking house prices page tracks the other monthly official series for the borough.
Frequently asked questions
What is the Woking claimant count in August 2026?
1,810 people in Woking borough were claiming unemployment-related benefits in August 2026, which is 2.7 per cent of residents aged 16 to 64. That is unchanged from July. Of those claimants, 345 were aged 16 to 24, 1,030 were aged 25 to 49 and 435 were 50 or over.
Is Woking’s claimant rate high for Surrey?
Yes. At 2.7 per cent, Woking has the second highest rate of Surrey’s eleven boroughs and districts, behind Spelthorne on 3.6 per cent. The Surrey average is 2.4 per cent. It is still well below the UK figure of 3.9 per cent.
Why are young people the fastest rising group?
These figures do not explain themselves, and we are not going to guess. What they show is that Woking’s under-25 claimant count rose 28 per cent in twelve months while the 25 to 49 count did not move at all, and that the same pattern appears in nine of Surrey’s eleven districts.
Is the claimant count the same as unemployment?
No. The ONS says the claimant count “does not attempt to measure unemployment”. It counts people claiming benefits principally because they are unemployed, which includes some Universal Credit claimants who are working a small number of hours on very low earnings and are still required to look for more work.
When are the next figures out?
Tuesday 20 October 2026, covering September. The ONS publishes the claimant count on the third Tuesday of each month.
Sources
- ONS claimant count by sex and age, via nomis (table NM_162_1), dataset last updated 07:00 on 15 September 2026, geography E07000217 Woking (the monthly series for all ages and for 16 to 24 year olds, the age and sex breakdowns, and the Surrey district comparisons)
- ONS: Claimant Count Quality and Methodology Information (what the claimant count measures and why it is not the unemployment rate)
Figures are rounded to the nearest five by the ONS. Checked against the sources above on 16 September 2026.
Have your say